
It happens all the time. A mom and I bond over our desire to explore this vibrant city with our budding urbanites in tow. I envision a friendship that blossoms over the years. Then she says, “We’re looking in Marin.”
“Why? Your place is perfect. You love San Francisco!”
“Yeah, but Mabel will be ready for kindergarten soon so…”
Or, just as often, a mom brings up the topic of the public school lottery at a GGMG Neighborhood Meetup, fretting over the limited number of “good” schools, the extremely low odds of getting assigned to one of them, and the nightmare that is the lottery. “What if my kid gets the lowest number in the city? Then he’ll be at the very end of every school’s list!” Anxiety spreads through the room like peanut butter on hot toast. I intervene, asking the speaker about her experience with the process. “Oh, Henry’s only three, but I hear…”
It’s natural to worry, especially about a system that’s more complex and less predictable than most. Yet much of the discussion among parents of young kids in San Francisco features a dearth of accurate information and an abundance of apprehension. The truth about our public schools may surprise you.
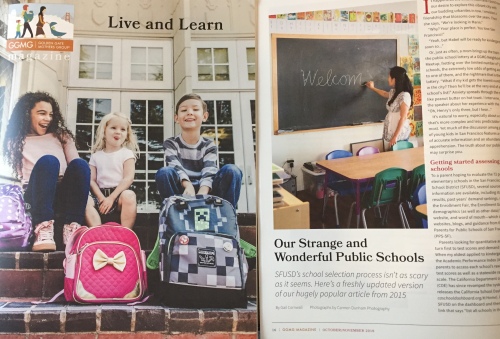
Getting started assessing schools
To a parent hoping to evaluate the 72 public elementary schools in the San Francisco Unified School District (SFUSD), several sources of information are available, including state test results, past years’ demand rankings, school tours, the Enrollment Fair, the Enrollment Guide, demographics (as well as other data) from SFUSD’s website, and word of mouth—which includes websites, blogs, and guidance from the nonprofit Parents for Public Schools of San Francisco (PPS-SF).
Parents looking for quantitative analysis usually turn first to test scores and demand rankings. When my oldest applied to kindergarten in 2013, the Academic Performance Index (API) allowed parents to access each school’s raw standardized test scores as well as a statewide rank on a 1-to-10 scale. The California Department of Education (CDE) has since revamped the system and now releases the California School Dashboard (www.caschooldashboard.org/#/Home). By pulling up SFUSD on the Dashboard and then clicking on the link that says “list all schools in this district,” you can see a colored pie chart representing each school in the “English Language Arts” and “Mathematics” columns. That color is meant to represent both last year’s scores and how the school is trending over time. Clicking on an individual school and then the “Status and Change Report” column provides more specific information. My kids’ school, Rooftop Elementary, is listed as “High” for English scores at “17.9 points above level 3,” for example, while Bessie Carmichael comes up as “Low” at “41.2 points below level 3.”
If it sounds like the state is making test scores more difficult to find, that’s because it is. The CDE’s website says “reducing the multiple measures to a single number would leave out information that is important.” Indeed, test scores are not, and never have been, a reliable proxy for school quality. Students described as “Socioeconomically Disadvantaged,” “English Learners,” and “Students with Disabilities” tend to score lower. A school with a higher percentage of these students will therefore have lower test scores, even if it is making tremendous strides educating them. The phenomenon has led many to assert that the numbers say more about incoming students than school quality and to refer to the old statistic as the “Affluent Parent Index.” And it’s why the new report shows Bessie Carmichael as green and “High” in the column marked “English learner progress” while Rooftop is yellow and “Medium” in that regard.
What’s more, all standardized testing fails to capture educational success—actual learning—to some degree. As Albert Einstein said, “Everything that can be counted does not necessarily count; everything that counts cannot necessarily be counted.”
That doesn’t mean the numbers are worthless, however. Back in 2013, I figured at a school with a statewide rank of 1, 2, or 3, the majority of students struggled to meet state standards for one reason or another. Conversely, at a school with a rank of 8, 9, or 10, most students—whether because of background or school quality—likely exceeded the standards. The same inference can likely be drawn using the new “High,” “Medium,” and “Low” labels (though I personally wouldn’t rule out “Low” scoring schools).
Demand rankings should also be used circumspectly. SFUSD releases a list of the top 25 most requested schools in the prior year’s lottery as well as supporting data that enables a parent to put the remaining schools in order of popularity. Yet factors unrelated to school quality—such as start time, availability of after-school care, geographic location, school size, and busing availability—play into parental preference. Also, demand rank can function as a self-fulfilling prophecy for two reasons. First, parents assume that the most in-demand schools from last year must be the best ones and rank them high on their list of desired schools. Second, for many years, including this past one, it was advantageous to slap high-demand schools at the end of one’s list (because of the lottery “swap” or “transfer” feature that has now been disabled). Since the metric is calculated using the total number of requests, the result is a demand-rank that doesn’t accurately reflect actual eagerness to enroll.
Moreover, both sets of numbers are unreliable indicators of personal desirability thanks to differing instructional character. Different parents want different educational environments. Luckily for all of us, SFUSD is incredibly diverse.
Beyond test scores and popularity
Although all public schools use the Common Core State Standards, quite a bit of pedagogical variation remains. There’s SF Public Montessori, which focuses on the Montessori method, and other schools feature project-based learning or have a science focus. Back in 2013, I walked into one classroom where the children sat rigidly around a long table, their hands tightly clasped in front of them. A teacher stood at the front of the room and used a wooden pointer to tap an overhead transparency displaying the letter “B.” She stated, “B, B, B says buh.” The children repeated in chorus, “B, B, B says buh.” At another school, instruction seemed predominantly child-led. One school I toured placed a premium on discipline, requiring uniformed students to walk in silent, single-file lines down the hallways, while others allowed more bodily freedom. Though the maximum number of students per class is set at the state level (22 for kindergarten), schools have two, three, or four classes. A school with 44 kindergarteners will be different than one with 88 in a way that cannot objectively be called good or bad.
I found myself looking for a mid-range school in terms of both size and structure. I wanted an environment where not everyone knew my child’s name, but most recognized her face. I liked seeing kids smiling and skipping through the halls, but didn’t want chaos. An extremely high-demand school with some of the best test scores in the city felt too rigid for me. I valued diversity, rejecting homogeneous schools, whereas others want their children to be surrounded by those of a similar background. A lot of parents prefer language instruction of some sort; we had no interest, which drove us toward the confusingly labeled “General Education” track. A lack of either arts or movement during some part of the day was a deal-breaker for me, but a friend couldn’t have cared less. I was ready to rally the troops; others want to know the PTA is already well-established.
All this is to say, what one parent considers a “good” school can be very different from what her neighbor seeks.
Though the SFUSD website contains quite a bit of qualitative information, tours and the Enrollment Fair (generally held in October) are the best way to learn about school culture as well as things like classroom feel, the presence of play structures, field trips, collaboration with businesses, sports teams, parent involvement, and the quality of the principal (which, by the way, should be judged based on what teachers and parents at the school think of their leadership not whether listening to their pre-tour spiel makes you want to hire them or grab a beer together).
Word of mouth can be invaluable if from a primary source, not the rumor mill. The hype schools receive is often both overblown and outdated, as schools change quickly. One source described Miraloma and McKinley as “dumping grounds” just a few years ago; now they’re two of the most in-demand schools in the city. Also, keep in mind that every school will have at least one disgruntled family, and most will have a few mega-fans. One way to get to the bottom of things is to attend a school event open to the public, like a PTA meeting or fundraiser.
After completing my online research, I thought I’d be competing for a handful of slots. Then I toured 16 schools. I found five that had everything we desired within walking distance. An additional five schools would require a longer commute but were still exciting in terms of quality and character. Here’s the part that shocks most people: half of those 10 schools sat low enough in the demand ranking that we could safely rely upon getting a seat.
How the lottery works
The SFUSD enrollment lottery is infamous for being confusing, and it is in many ways a terribly outdated, overly cumbersome disappointment. But it’s also a quick study.
Parents can apply to as many of SFUSD’s kindergarten programs as they like; that’s more than 100 options, counting language programs separately. There are “attendance area” (AA) schools for which residing near the school may come into play in the enrollment process and “city-wide” schools and programs for which it won’t. Each school that is not “city-wide” has an area of neighboring streets delineated on a map, but the school doesn’t always sit right in the geographical center; as a result, your AA elementary school may not be the one closest to you.
Parents submit an application in January (January 11, 2019, for the 2019-2020 school year) with supporting paperwork (like a birth certificate) that lists the programs they wish to apply to in order of preference. This form effectively functions as a separate application to each program listed. Each program then runs a lottery and randomly assigns each student in its pool of applicants a number. In other words, your child will have a separate lottery number at each school, meaning the common fear of ending up at the end of every school’s list is misplaced.
When there are more applicants than available seats, seats are not filled strictly in lottery order. Each school first pulls out students that have “tie-breaker” statuses.*
*Note: The order of tie-breakers is slightly different at city-wide language pathway schools, something SFUSD’s Educational Placement Center (EPC), PPS-SF, and the Enrollment Guide provide more information about.
Tie-breaker One: Younger siblings of enrolled students receive seats first. That means if your son was assigned lottery number 11, but a girl assigned number 135 has an older sibling attending your first-choice school, she will get a seat first.
Tie-breaker Two: Students who live in the attendance area of an AA school and are already attending a pre-K or transitional kindergarten (TK) in that same attendance area—or, for citywide schools, students attending a PreK or TK program at that school—get preference next. A small number of children qualify for this tie-breaker.
Tie-breaker Three: The “test score area” or “CTIP-1” (Census Tract Integration Preference-First Percentile) category attempts to give disadvantaged students access to the city’s most in-demand schools. Applicants who reside in census tracts (basically chunks of neighborhoods) with the lowest average test scores get pulled out next. That means if your son has lottery number 11, but a girl assigned number 135 lives on Treasure Island, she will get a seat first. Since location is an inaccurate proxy for need, some children of means benefit from this preference, especially in rapidly gentrifying areas like the Mission. (For this and other reasons, the CTIP-1 tie-breaker is the most controversial part of the lottery process. Some have sought to give this tie-breaker less sway, but the Board of Education has thus far rejected these proposals, noting that public school choice in San Francisco is intended “to help create diverse learning environments.”)
Tie-breaker Four: Finally, students who live in the attendance area of an AA school will receive seats.
Only after offering these groups placement will each school tick down its remaining applicants in the order assigned by its lottery. That means your child could draw lottery number 11 at your first choice kindergarten, there could be 66 seats available, and you still might not get a seat. The highest odds of this happening are for applicants living outside the attendance area of a high-demand AA school.
You will always be given your highest ranked choice that is available. If the computer runs through this whole process and a seat is not available at any of your listed programs, your child will be offered a seat at your AA school if any seats remain, or, if they don’t, at the school closest to your street address that has a seat available (unless you’ve specified a preference for a language pathway on the application form, in which case it will be the closest language pathway with openings).
If you’re unhappy with your child’s March school assignment, there are subsequent rounds. In the second round, with applications due in April, you list only those schools you would prefer to the one to which your child was first assigned. Offers will go out again in May. Families who miss these deadlines or are unhappy with their assignment can enter a “wait pool” request for a school in June and again in August, though at that point close contact with staff at SFUSD’s Educational Placement Center is the best bet, since seats continually open as kids move out of town or opt instead for a private or charter school (which use separate application and admissions processes).
Your odds and the bird’s-eye view
Of the 30-plus families with whom we navigated the enrollment process for our daughter in 2013, about 25 got their first choice in the first round. Every single family who stuck with the process eventually obtained a seat in their first choice program. Some put down a private school deposit in order to quell the fear of an unacceptable option come August, ready to walk away from a seemingly big chunk of change knowing that it actually pales in comparison to saving upwards of $10K per child per year, the state average for private school tuition. (One can even recoup a deposit or tuition payment through careful navigation of the contract termination process or by purchasing tuition reimbursement insurance.)
SFUSD statistics support this anecdotal evidence. In last year’s lottery, 73 percent of kindergarten applicants received their first or second choice placement in the first round of the lottery. More than half (63 percent) got assigned to their first choice school right off the bat. It’s true that these statistics include the younger siblings of already enrolled students, but they’re impressive nonetheless. It’s unclear exactly how many families obtain their first choice school assignment by hanging in there through the summer, but Rachel Nip, formerly of PPS-SF, reported in 2015, “Last year about 700 kindergarten families received a seat at their waitpool school.”
A small number of families inevitably receive the short end of the stick, but the odds are in your favor. The notion that SFUSD has very few good schools that are impossible to get into is just plain wrong. The more families trust in this fact and invest in our schools, the more wrong it will be.
When I meet parents who accept this premise but are still frustrated with the complex process and lack of predictability, I try to provide perspective with two points. First, the biggest time suck is in learning the system. By reading this far, you’ve done that. You don’t need to tour 16 schools. Just pull up the map of schools, flip through the Enrollment Guide, attend the Enrollment Fair, tour the handful of schools that seem like they might work well, and add on any others you’d be willing to give a try. Filling out and submitting the actual application takes only an hour or two, and the mechanics of the process are spelled out clearly in the Enrollment Guide. Second, when we lived in downtown Seattle, our kids were zoned for a school a 25-minute bus ride away from our home. There was no ability to maximize for walkability, to contemplate whether our child would thrive in a larger or smaller school, to seek out a disciplinary ethos that felt right to us. Coming from that situation, the opportunity to engage in the SFUSD lottery felt like a blessing.
Choice and uncertainty can be overwhelming, but both breed opportunity. Ignore the hype; quell the panic. Look for the beauty in our big, multicultural, and pedagogically diverse school system. And then do what’s best.
This article first appeared in the October/November 2018 issue of Golden Gate Mothers Group Magazine. Gail Cornwall’s work has been published online by The Atlantic, The Washington Post, The New York Times, Salon, and U.S. News & World Report, among others – as well as in print by Parents and The San Francisco Chronicle. Click here for a full list of articles.
